Tutorial
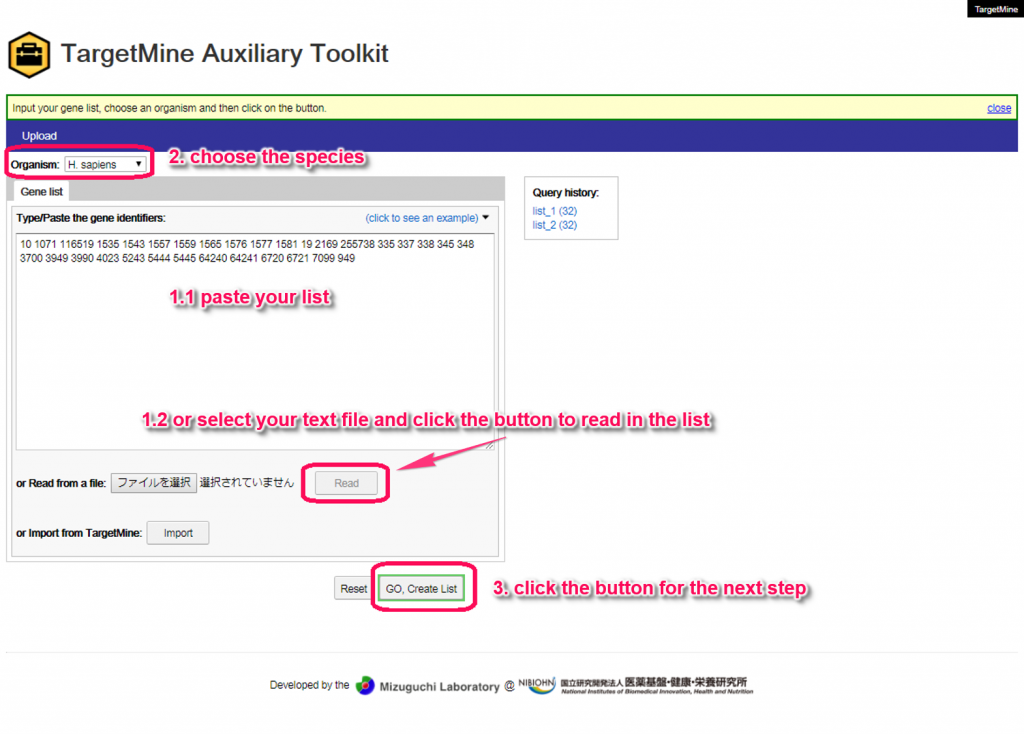
- Upload a list of gene by pasting into the text area or selecting a file then clicking on the “Read” button.
- Click the button to upload
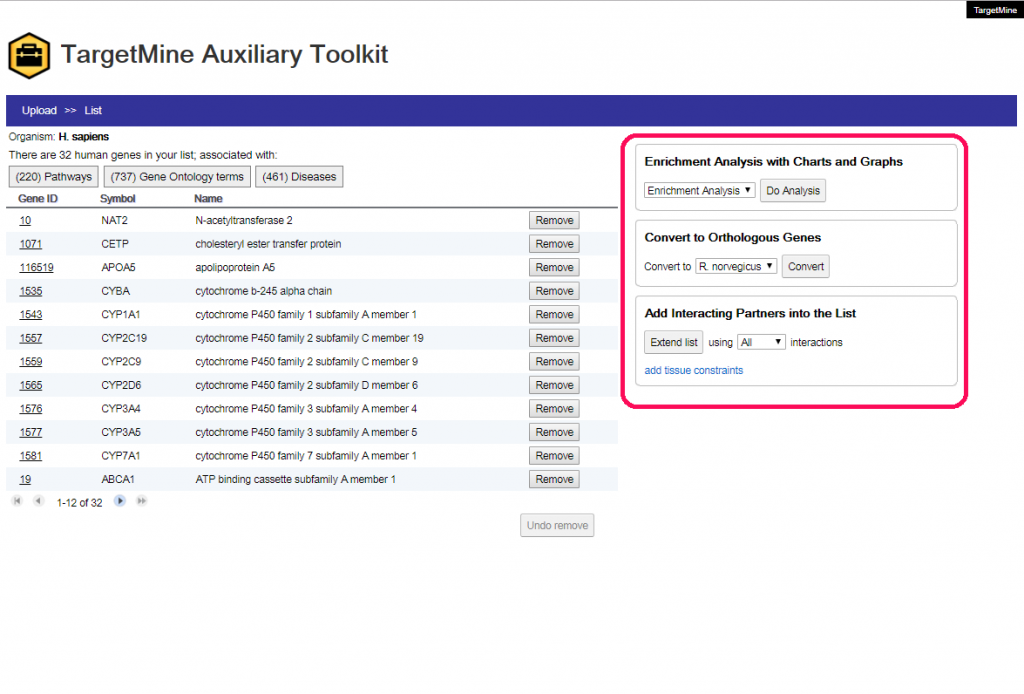
- You can convert your genes to orthologs, add interacting partners in to the list or directly do the enrichment analysis.
These processes could be use as different combinations.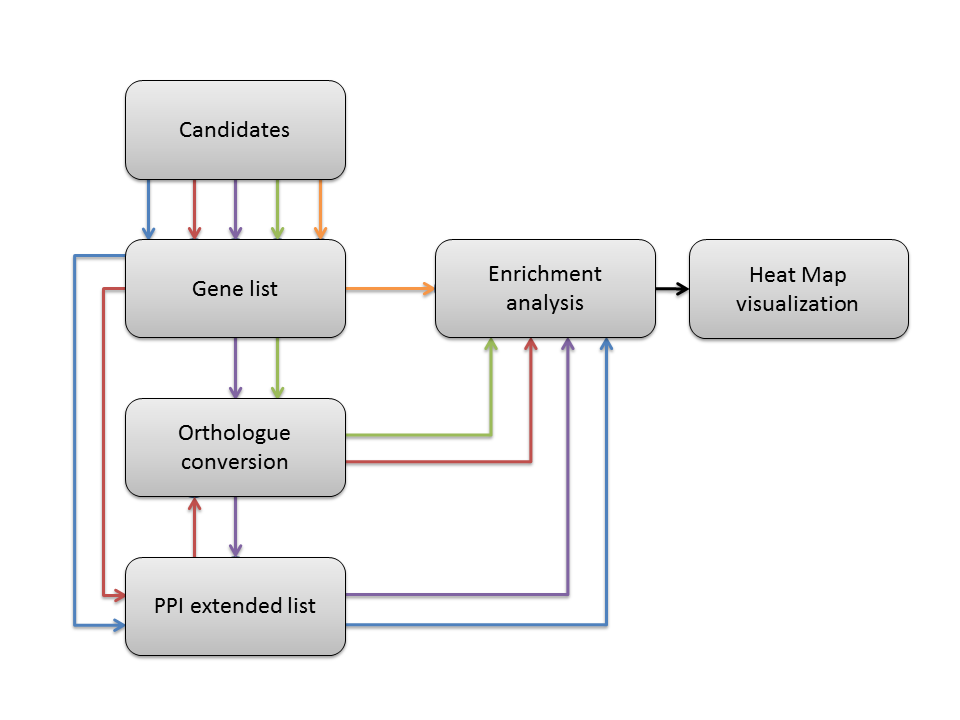
- The enriched results can be examined with a bar chart. You can change the enrich theme by using the drop down menus.
- Click the “Show HeapMap” button will visualize the genes and the selected biological items in the form of Heat Map.
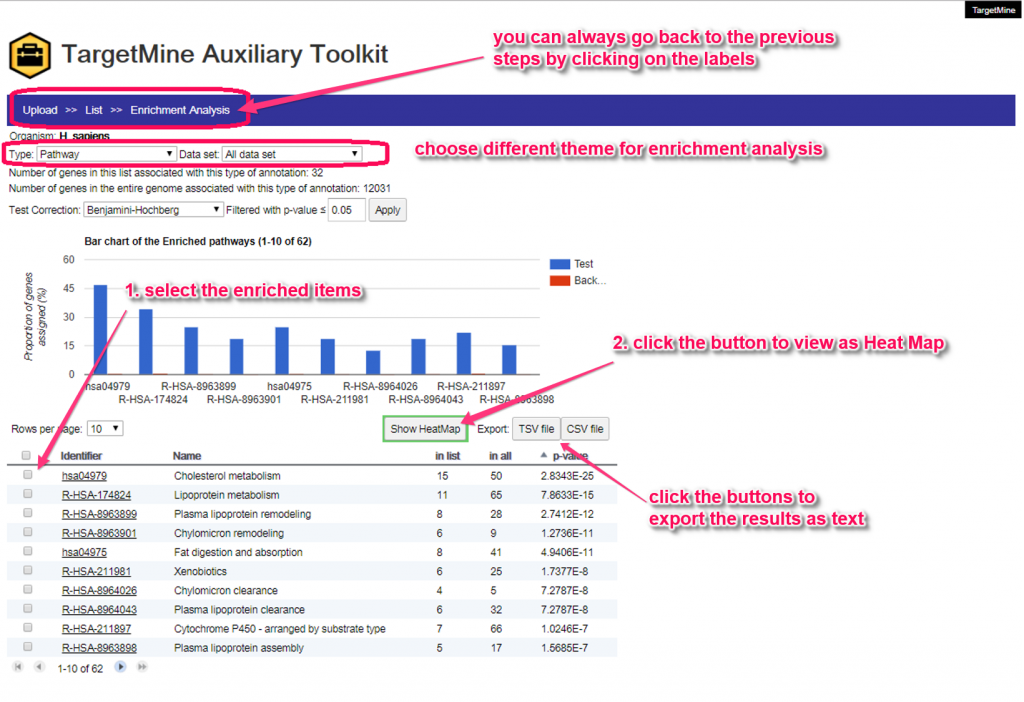
- In the KEGG or Reactome pathway enrichment results, you can click on the pathway name to see the mapped results on the original site respectively.Please see ‘map the Enrichment results to KEGG or Reactome‘ for more details.
- In addition, clicking on the identifiers in the enrichment result table will show the enriched them in TargetMine and clicking on the number at the ‘in list’ column will show all the associated genes in TargetMine as a query results. You can also sort the table by clicking on the table headers.
- In the heat map visualization, you can customize the color. You can also export the image or the matrix.
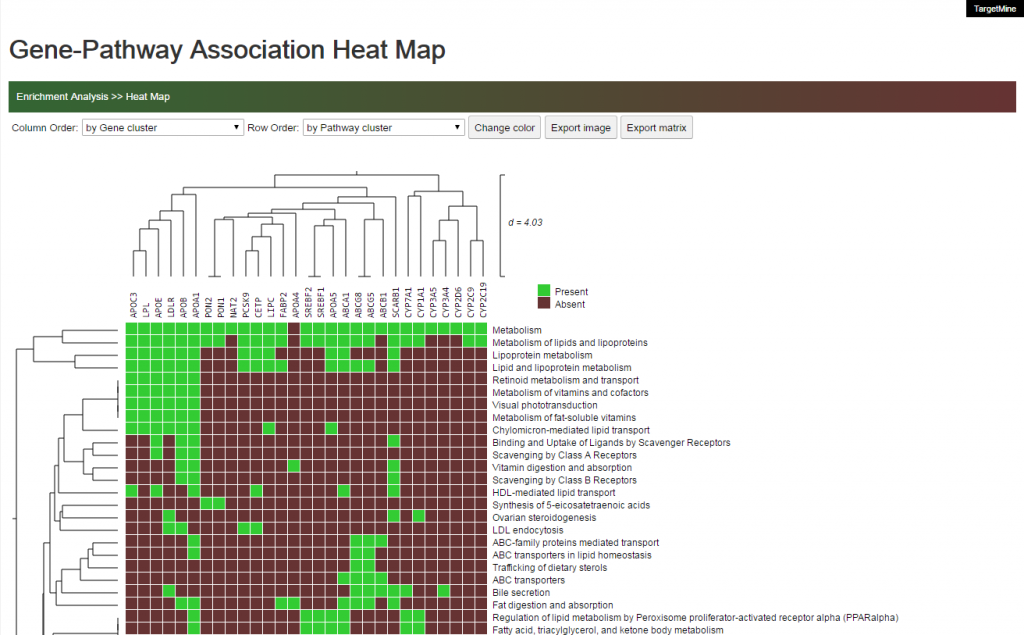
The heat map visualization could be also applied for visualizing other data types. See “Association Heat Map” for more details.
