Association Heat Map provides an alternative view of the biological annotations. Not only for displaying the enrichment results, but it could be used independently. An easy way to use “Association Heat Map” is exporting the query results from TargetMine. This page will show you how to do it.
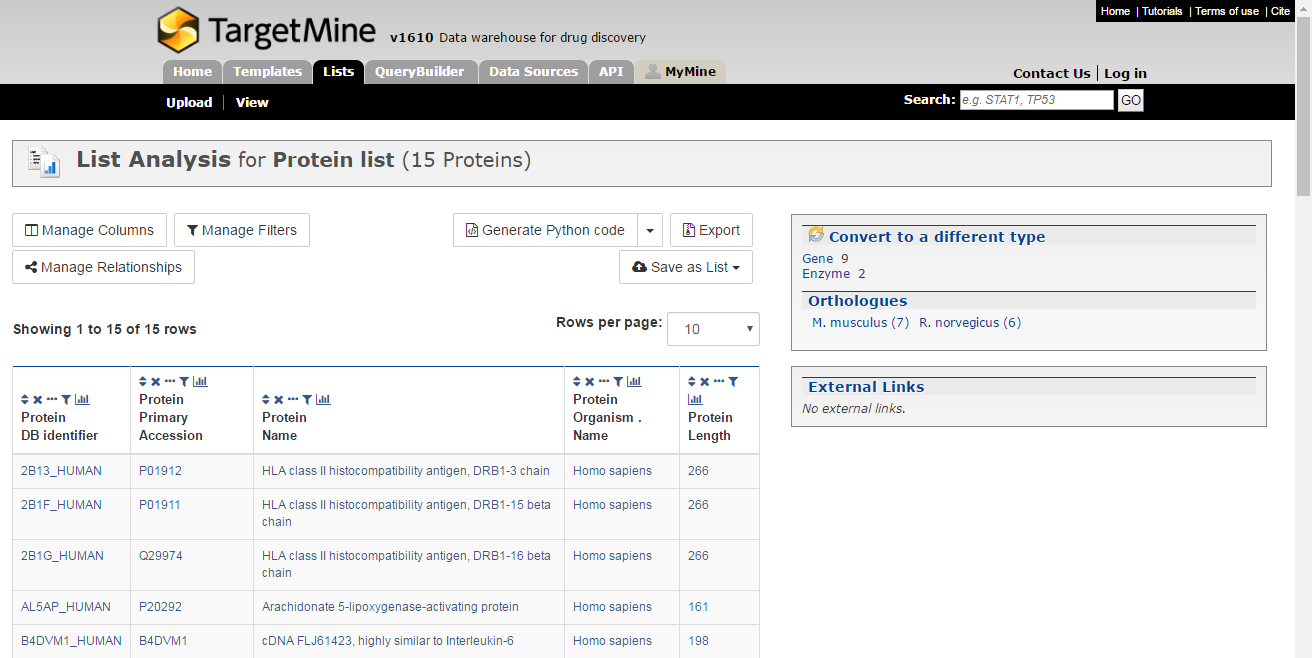
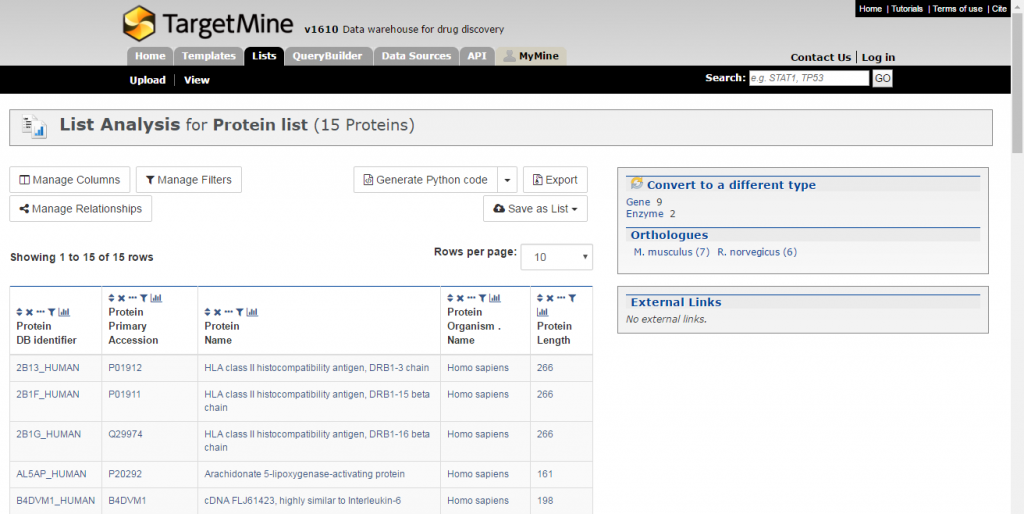
- Suppose you have uploaded a protein list to TargetMine.
(If your don’t know how to upload a list, see the ‘Lists‘ page.)
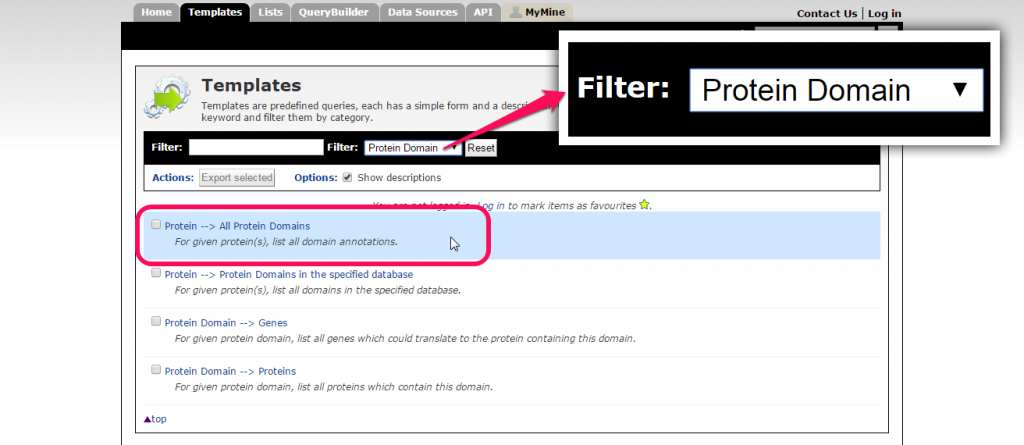
- Suppose we want to query the protein domains annotated to the proteins in your list. First we go to the Templates tab, and filter the templates (predefined query) by choosing ‘Protein Domain’ in the drop-down choice. Then select the template ‘Protein –> All Protein Domains‘.(If your don’t know how to use the templates, see the ‘Templates‘ page.)
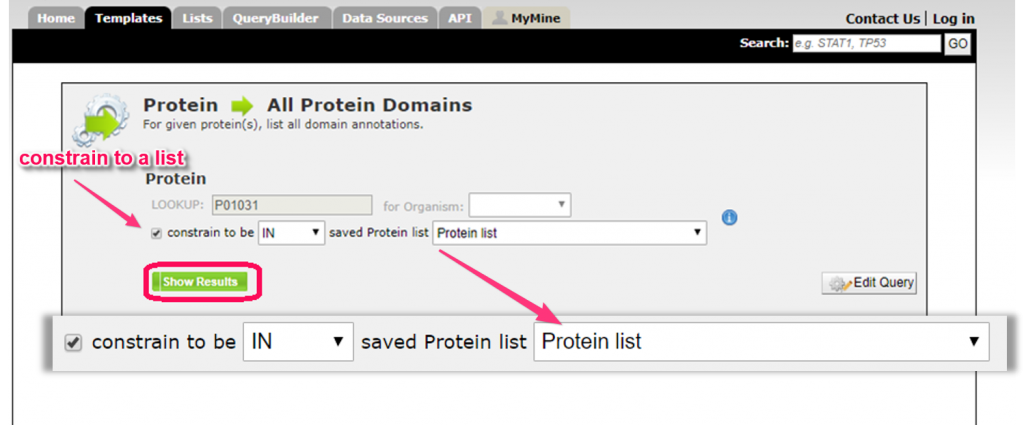
- Click on the check box and constrain to the proteins in your uploaded list and run the query.
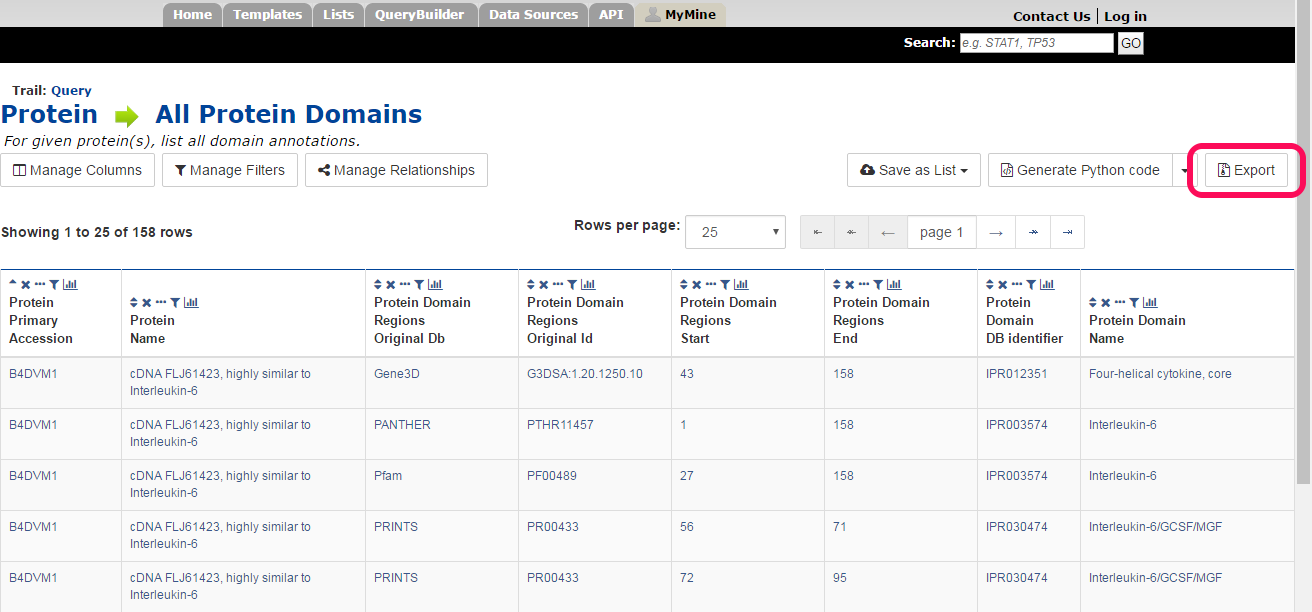
- Click the ‘Export’ button at the upper right of the query result page.
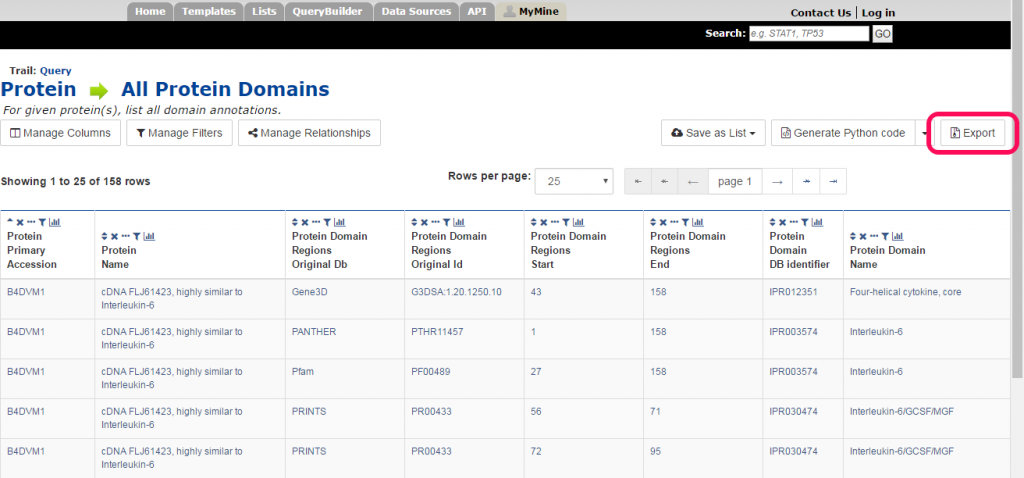
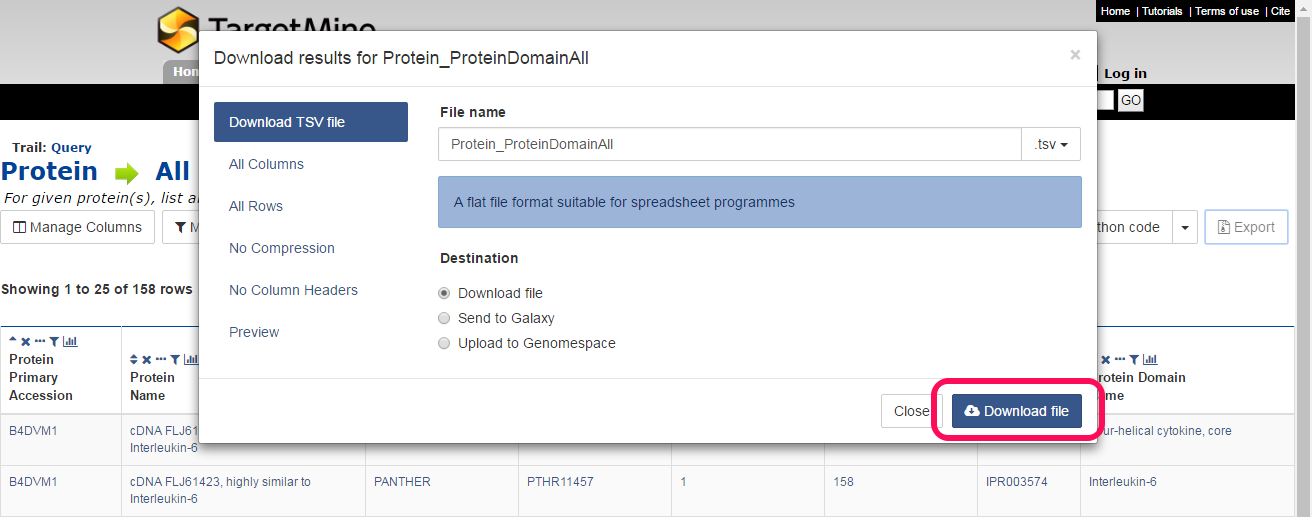
Then download the query results.

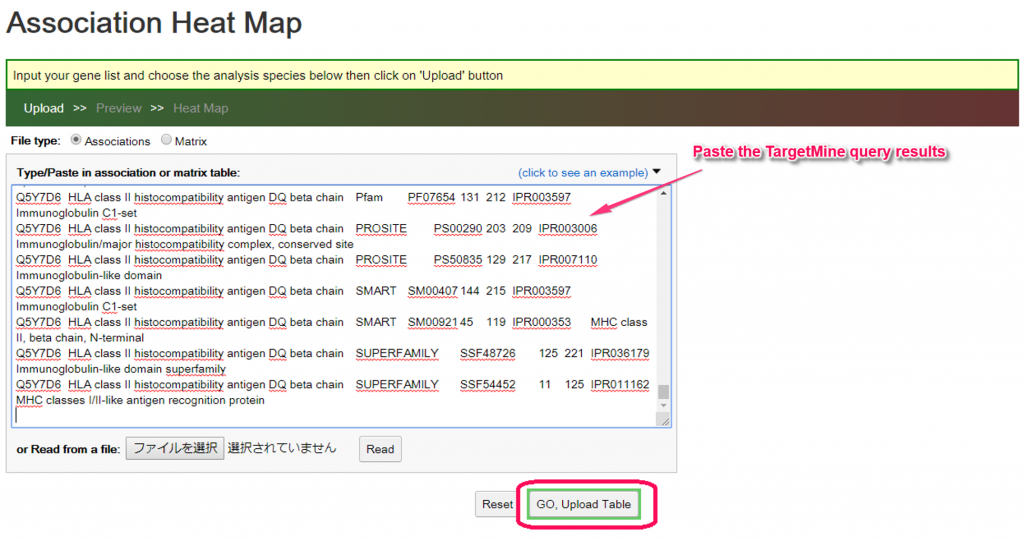
- Go the the ‘Association Heat Map‘ application. Paste the downloaded results in the text area and click “GO, upload Table” to continue.
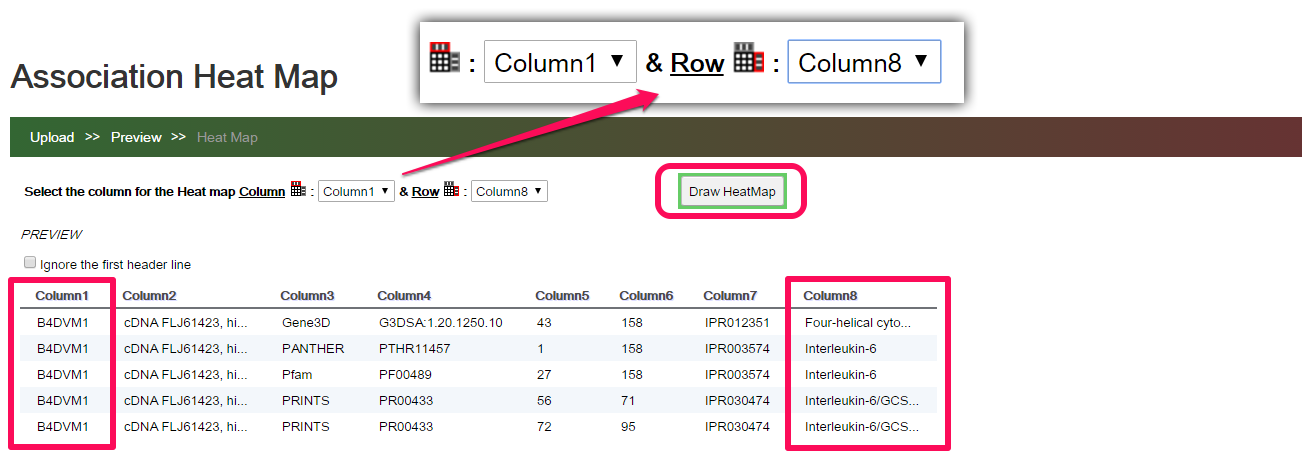
- Choose a pair of the columns you would like to see in the heat map. In this example, we would like to see the protein (accession) to the InterPro domain (name)m thus, choose ‘Column 1’ and ‘Column 8’ respectively. The click ‘Draw Heat Map’ to show the heat map.

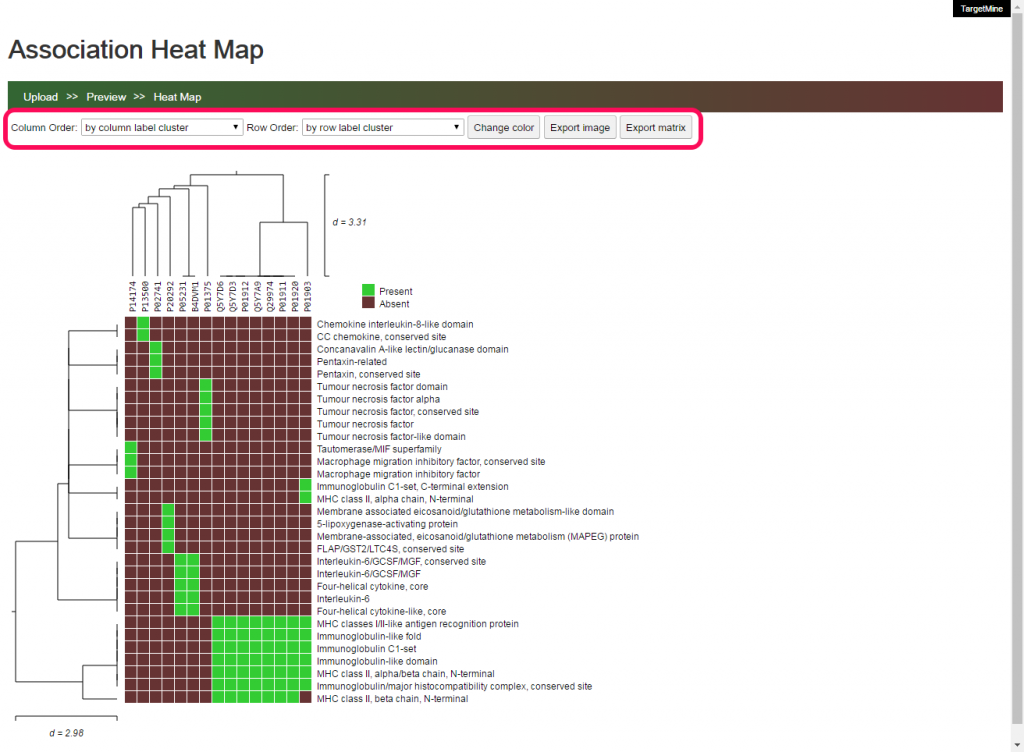
- You can change the order using the drop down choice. Click on the ‘Change Color’ button will show a dialog window for changing the color. You can also use the ‘Export image’ and ‘Export matrix’ to export the results.