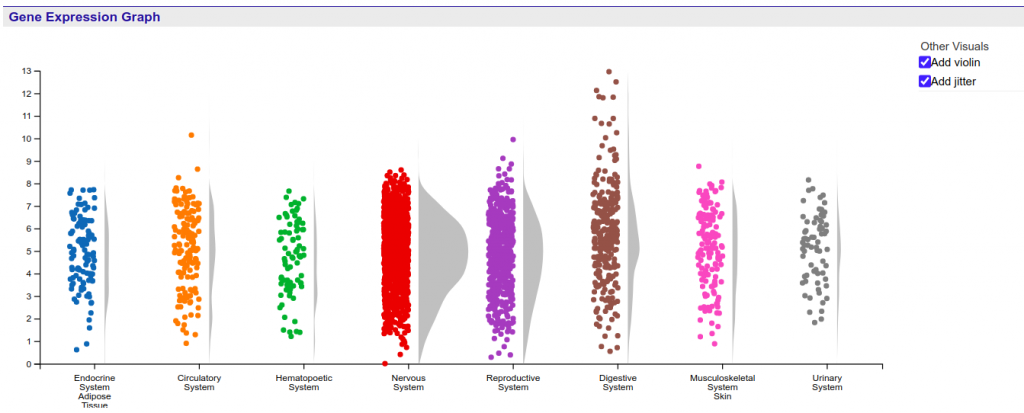
The gene expression graph is allocated at the summary section of the Gene report page which provides an overview of the Gene’s information, including various identifiers and its description. The gene expression graph is a summary graph of the expression of the gene in various tissues, like the one shown in the Figure 1.
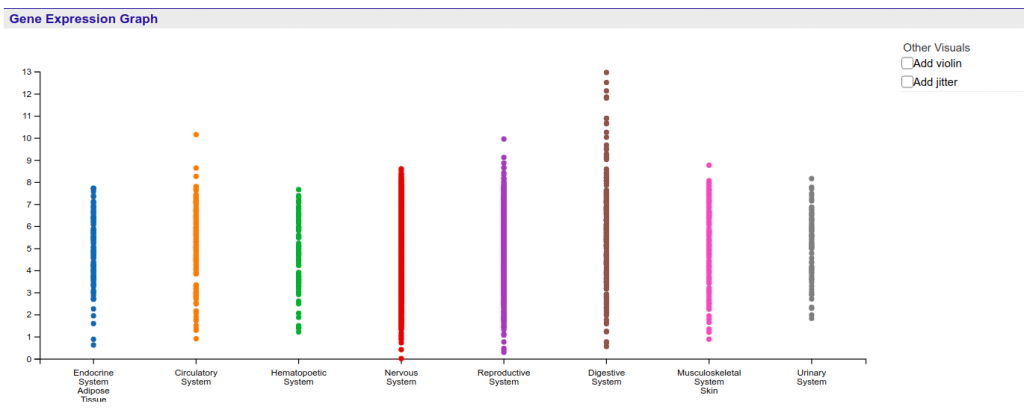
The graph displays the HBI expression values stored at every probe associated with the target Gene stored in the system. Values are shown using a linear scale, and are grouped according to the tissue where the expression value was measured.
There are currently two different ways in which users can interact with the data contained in the graph.
First, by left or right clicking the labels of the graph, the user is able to expand and contract the levels of specificity at which the samples are shown. Currently there are three levels available. Figure 2 shows an example of how inner categories of the Endocrine System / Adipose Tissue can be reached through two sequential expansion operations.
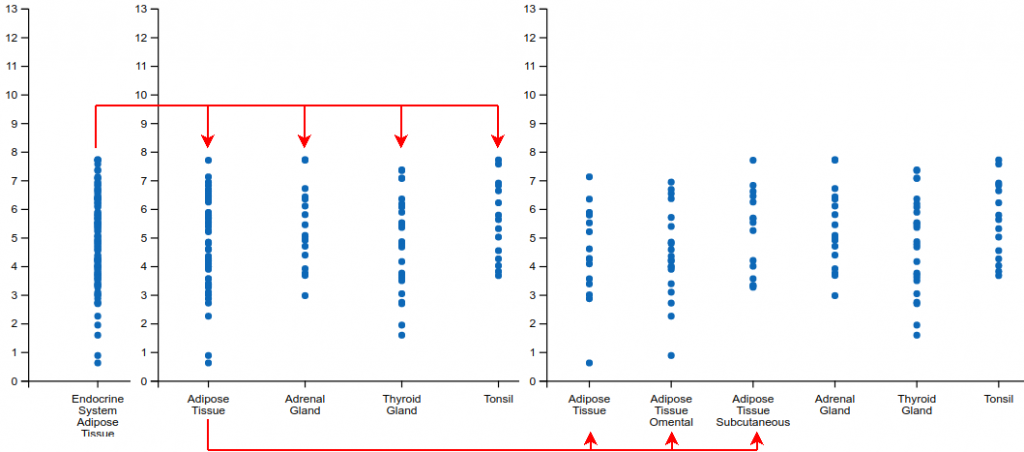
Notice that right clicking (contracting) a level 2 label will also contract all level 3 labels of the same category into the highest level of sample tissue.
Second, the plot can also be modified with the inclusion of jitter and violin representations of the distribution of the samples. Both these additions can be selected and unselected through the checkboxes located in the top right corner of the graph. Notice that, once selected, the visual cue is independently applied to all currently displayed categories in the graph, including expanded levels of organization. Figure 3 shows the original graph after applying both these modifications.